
Exploration
MAY RIVER PROJECT
In October 2013, the joint venture with Mincor was terminated by agreement and 100% interest in the project reverted to Niuminco.
In January 2014, Mr John Nethery conducted a detailed review of the historical data in respect of EL1441, as well as the Frieda River group of prospects, and his report can be read here.
At May River, airborne geophysics has identified a number of targets for follow up. A VTEM (Versatile Time Domain Electromagnetic) survey comprising 3074 line kilometres and split into two areas – 1977 line kilometres over the northern part of the tenement, (mainly targeting volcanogenic massive sulphide type targets) and 1097 line kilometres in the southern part, (to the west of Frieda River where the main target was Nena style epithermal systems) was completed. The new ZTEM system (Z-Axis Tipper Electromagnetic) was also utilised over the southern area, in conjunction with the VTEM to better define the geology and structural setting of the area and to help define potential porphyry-type systems.
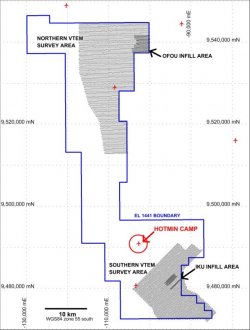
On commencement of the Mincor – Niuminco Joint Venture, it was decided that the most effective way to approach the May River area was to compile and interpret all historical data and to fly appropriate airborne geophysical surveys over key areas. This comprised a VTEM survey over the northern part of the tenement, including the Ofou prospects and coincident VTEM and ZTEM surveys over the southern portion (Figure 1). The southern area incorporates a part of the Frieda River Complex, host to the giant Frieda River deposits. This provided an effective means of screening an extremely remote area for additional targets whilst gaining additional information about the regional geology and areas of known mineralisation. The VTEM survey collected magnetic data at the same time. VTEM and ZTEM survey reports are included as Appendix 1 and Appendix 2 together with a magnetic image showing the location of the Frieda River deposits as Appendix 3.
Compilation of existing data proved to be a difficult task due to poor document filing at the Mineral Resources Authority (MRA), poor re-production of old maps and reports, numerous co-ordinate systems, un-located data, varying geological classifications and missing information in general however, a large amount of useful data has been captured. Regional magnetic data was purchased and re-processed by Southern Geoscience Corporation (see Appendix 3).
 |
|
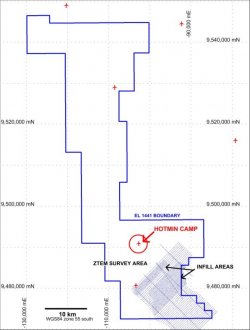
Figure 1: Flight lines showing VTEM coverage at May River (left) and ZTEM coverage (right)
SOUTH MAY RIVER
In the South May River area, a VTEM (Versatile Time domain ElectroMagnetic) survey comprising 1097 line kilometres was completed and covered the western portion of the Frieda River Igneous Complex, the eastern portion of which hosts the giant Frieda River porphyry and epithermal copper and gold deposits. EM is not ideally suited to exploration for porphyry deposits due to a lack of conductive massive sulphides, however, porphyry systems commonly give rise to nearby satellite deposits (commonly epithermal or skarn, depending on geological environment) which are amenable to EM. At Frieda River, ground EM surveys at the Nena deposit (52Mt at 2.1% copper) have shown that the ore body is detectable so given the potential for similar deposits to occur within EL1441 it was decided that flying of VTEM would worthwhile. Nena is an epithermal deposit related to the large porphyry systems at Horse, Ivaal and Trukai (HIT) which collectively make up the Frieda River resource (2090Mt at 0.45% copper, 0.22g/t gold and 0.7 g/t silver). Similar porphyry style mineralisation, if present at South May River would not be detectable by EM so it was decided to fly a new airborne technology called ZTEM (Z-axis Tipper ElectroMagnetics) as well, thus maximising the chances of detecting both Nena style epithermals and HIT style porphyries. ZTEM is a technique that measures variations in the earth’s natural electromagnetic field, essentially identifying areas which are less resistive than the norm and which may thus be more conductive, perhaps due to the presence of sulphides. It uses the natural or passive fields of the Earth as the source of transmitted energy and can be used to target large disseminated sulphide ore bodies for which VTEM and other standard electromagnetic systems are not effective. A total of 795 line kilometres of ZTEM data were acquired during the survey along lines spaced 400m apart and with infill to 200m over areas of interest.
Modeling of VTEM, ZTEM and aeromagnetic data comprising 2D and 3D inversions was carried out. This comprised 3D inversion modeling of the entire South May River ZTEM dataset, the entire South May River aeromagnetic dataset and a portion of the VTEM dataset covering the Iku Hill area. Separate modeling of individual VTEM anomalies was also carried out.
Based on modeling and interpretation to date, 22 primary and 16 secondary targets have already been identified for follow-up (Figures 2, 3, 4 and 5).
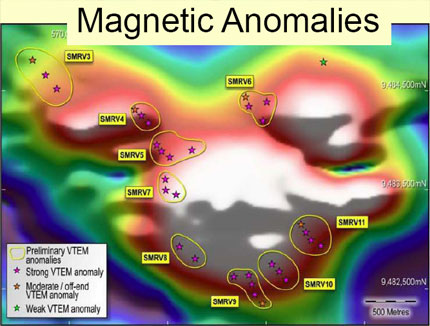
Of significant interest is the newly identified Iku Hill area where a cluster of VTEM anomalies surrounding a central magnetic high (SMRV4 to SMRV11). The distribution of the VTEM anomalies may represent mineralisation associated with a central intrusive stock (represented by the magnetic high) which may have acted as both a heat engine and mineralising fluid source – a common scenario in porphyry and epithermal environments. These anomalies (apart from SMRV6) also fall within anomalous ZTEM zones (SMRZ3, SMRZ6 and SMRZ7) that are present in the ZTEM data as coincident areas of low resistivity surrounding a central area of high resistivity (Figure 3). Additional anomalous ZTEM zones are also outlined by SMRZ4 and SMRZ5. ZTEM data inversion trials using cross line 90350 shows a highly resistive, topographic and magnetic high core zone, flanked by zones of high conductivity/low resistivity with inversions indicating resistivity likely to be <<100ohm.m (Figure 4). Published geological mapping from the 1970’s shows that this central area, which is also a topographic high (Iku Hill), may be underlain by intrusive diorite porphyry. The composition and age of the underlying geology has not been accurately determined however but the mere presence of such a combination of anomalies in a known world class mineralised environment is cause for detailed interpretation and follow-up.
>
|
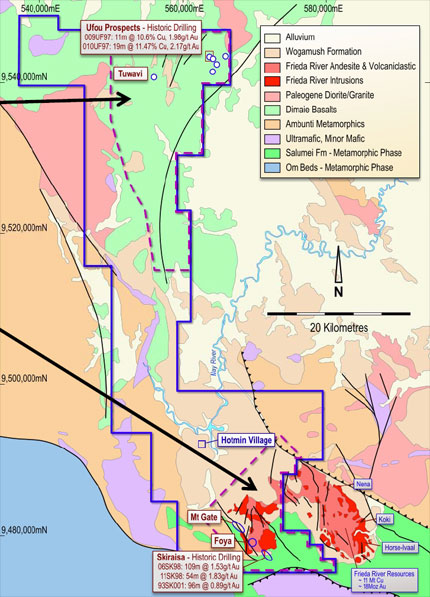
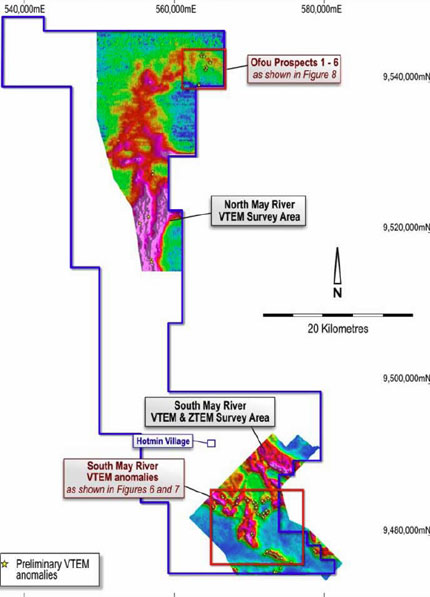
Figure 2: Location of airborne survey areas at May River. VTEM was flown over both areas (channel 35 image shown on right) and ZTEM over the southern area only. Underlying geology is shown on the left |
Figure 3 |
In addition to the above, a northwest – west-northwest line of VTEM anomalies (SMRV12 and SMRV13) within an elevated ZTEM response (SMRZ9 and SMRZ12) occurs to the west/southwest of the Skirasia – Foya – Mountain Gate trend, shown in Figures 2 and 5. The Mountain Gate and Skirasia trends are not apparent at all in VTEM but are subtly defined in ZTEM higher frequency information (300Hz) – SMRZ10 and SMRZ11 respectively. The distinct lack of VTEM response may be indicating a gold system with low sulphide content in that area as Skirasia, Foya and Mountain Gate are all described as being associated with diatremes – not a typical environment for electromagnetic (ie massive sulphide type) targets but still likely to be localised products of the greater mineralising environment. The significance of a sub-parallel trend that is apparent in both VTEM and ZTEM data is not known at this stage however, once again, the presence of these anomalies in such a prospective setting warrants careful investigation.
 |
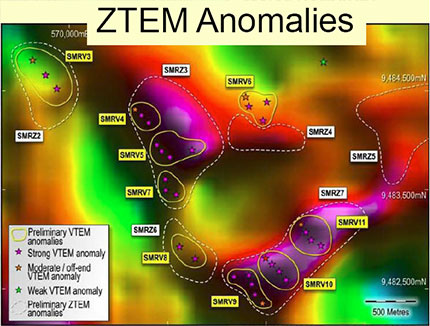 |
Figure 3: The image on the left shows the position of preliminary VTEM anomalies superimposed on a regional magnetic image. The anomalies are marginal to a central magnetic high (intrusive which forms Iku Hill, a topographic high) with marginal zones and apparent northwest grain also anomalous in ZTEM data (see right hand image).
A further 3 primary VTEM anomalies at this early stage of data assessment have also been identified (SMRV1, SMRV2 and SMRV3). An additional broad and separate ZTEM anomaly (SMRZ8) has also been outlined just SW of the main cluster. These are also shown in Figure 5 and will be further evaluated following more detailed data processing and interpretation.
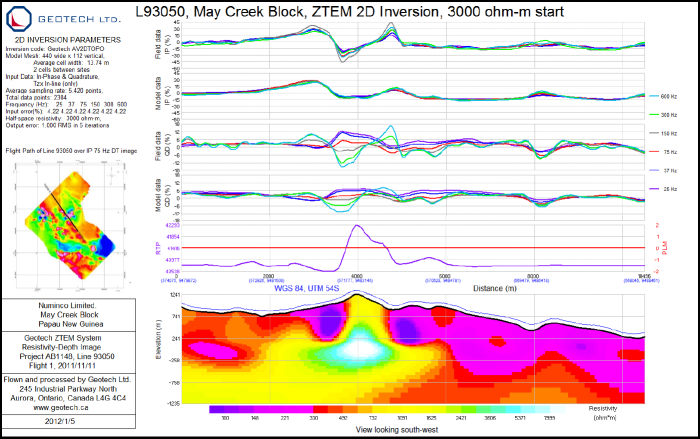
Figure 4: Resistivity-depth image from trial 2D inversion modeling of ZTEM cross line 90350 clearly showing a highly resistive, topographic and magnetic high core zone, flanked by zones of high conductivity/low resistivity (see inset for line location). This compliments the pattern seen in plan (figure 3)
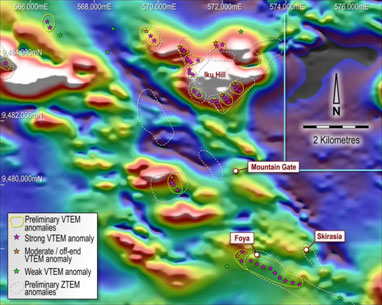 |
Figure 5: Additional preliminary VTEM anomaly locations within the south May River survey area superimposed on regional magnetic image . |